Peak Integration – Divide Peak
Follow these basic steps to perform an Peak Integration analysis including divided areas:
- Click on the desired curve to analyze.
- Select Peak Integration from the Analysis > Function menu.
- Click Analyze.
- Click Edit Analysis.
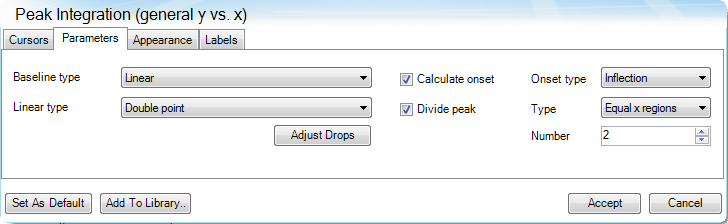
- Check the Divide peak option to divide the area under the curve based on the Type selection:
- Equal x regions: Divides the main peak equally into the number of regions specified.
- Fixed x interval: Divides the main peak based on the x-interval specified.
- Specific x: Used to define the exact x-axis limits to divide the main peak. More than one entry can be specified by separating multiple entries with # (for example, 125#150).
- At peak: Divide the main peak into two areas at the peak position. Note that there is a maximum of 10 partial areas.
-
Once the perpendicular (vertical) dividing lines are in place, you can adjust their position by clicking Adjust Drops, then manually repositioning the vertical dividing lines. Then click Finish Adjust.
- Click Accept to execute the analysis. Click Cancel to cancel the analysis functions.
Refer to Available Analysis Functions for details on Peak Integration options.
See Also
Basic Steps to Analyzing Data
